-
 Continue reading →: What is Quality 4.0?
COMING FEB 2020 My first post of 2018 addresses an idea that’s just starting to gain traction – one you’ll hear a lot more about from me soon: Quality 4.0. It’s not a fad or trend, but a reminder that the business environment is changing, and that performance excellence in…
-
Continue reading →: How to Assess the Quality of a Chatbot
Quality is the “totality of characteristics of an entity that bear upon its ability to meet stated and implied needs.” (ISO 9001:2015, p.3.1.5) Quality assurance is the practice of assessing whether a particular product or service has the characteristics to meet needs, and through continuous improvement efforts, we use data to…
-
Continue reading →: A Simple Intro to Q-Learning in R: Floor Plan Navigation
This example is drawn from “A Painless Q-Learning Tutorial” at http://mnemstudio.org/path-finding-q-learning-tutorial.htm which explains how to manually calculate iterations using the updating equation for Q-Learning, based on the Bellman Equation (image from https://www.is.uni-freiburg.de/ressourcen/business-analytics/13_reinforcementlearning.pdf): The example explores path-finding through a house: The question to be answered here is: What’s the best way to…
-
 Continue reading →: Reinforcement Learning: Q-Learning with the Hopping Robot
Overview: Reinforcement learning uses “reward” signals to determine how to navigate through a system in the most valuable way. (I’m particularly interested in the variant of reinforcement learning called “Q-Learning” because the goal is to create a “Quality Matrix” that can help you make the best sequence of decisions!) I…
-
Continue reading →: A Newbie’s Install of Keras & Tensorflow on Windows 10 with R
This weekend, I decided it was time: I was going to update my Python environment and get Keras and Tensorflow installed so I could start doing tutorials (particularly for deep learning) using R. Although I used to be a systems administrator (about 20 years ago), I don’t do much installing…
-
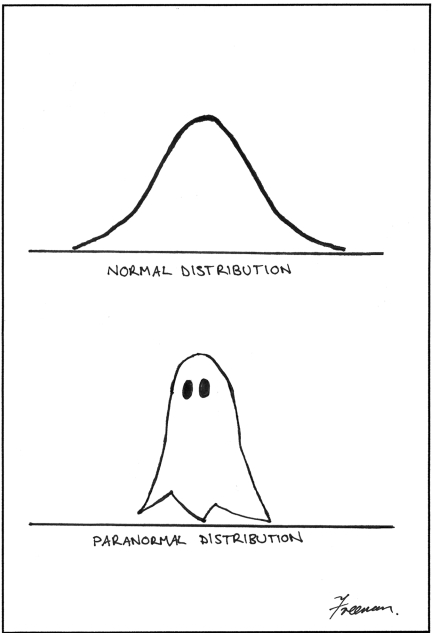
 Continue reading →: Where Do Z-Score Tables Come From? (+ how to make them in R)
Every student learns how to look up areas under the normal curve using Z-Score tables in their first statistics class. But what is less commonly covered, especially in courses where calculus is not a prerequisite, is where those Z-Score tables come from: figuring out the area under the normal curve…
-
Continue reading →: Taking a Subset of a Data Frame in R
Note: Everything in this article is easier with dplyr and magrittr in tidyverse. I’ll write a followup sometime this year. I just wrote a new chapter for my students describing how to subset a data frame in R. The full text is available at https://docs.google.com/document/d/1K5U11-IKRkxNmitu_lS71Z6uLTQW_fp6QNbOMMwA5J8/edit?usp=sharing but here’s a preview: Let’s load…
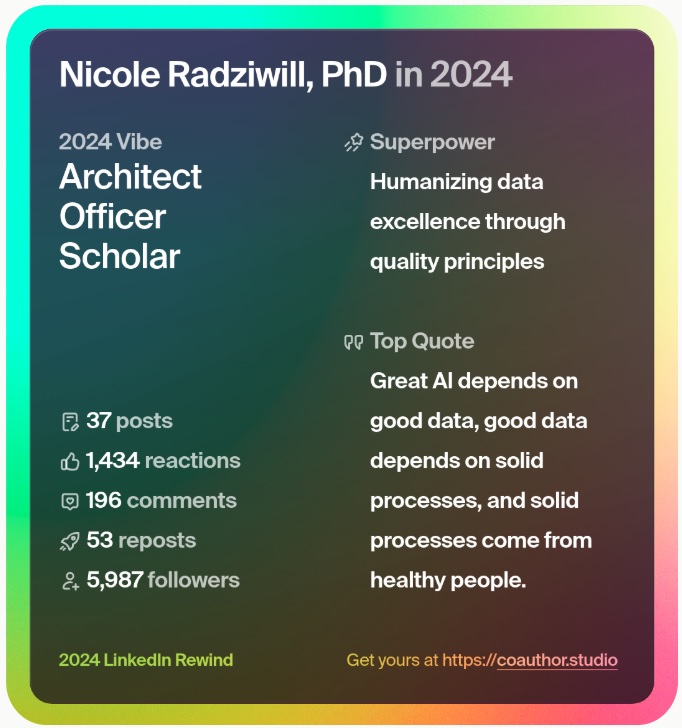
Hello,
I’m Nicole

Since 2008, I’ve been sharing insights and expertise on Digital Transformation & Data Science for Performance Excellence here. As a CxO, I’ve helped orgs build empowered teams, robust programs, and elegant strategies bridging data, analytics, and artificial intelligence (AI)/machine learning (ML)… while building models in R and Python on the side. In 2025, I help leaders drive Quality-Driven Data & AI Strategies and navigate the complex market of data/AI vendors & professional services. Need help sifting through it all? Reach out to inquire – check out my new book that reveal the one thing EVERY organization has been neglecting – Data, Strategy, Culture & Power.