Skip to content
(c) 2008-2024
Quality and Innovation
Search
About Nicole
Books
Consulting
Contact
Courses
Influential Voices (ASQ)
Posts (2008-2012)
Category:
Measurement
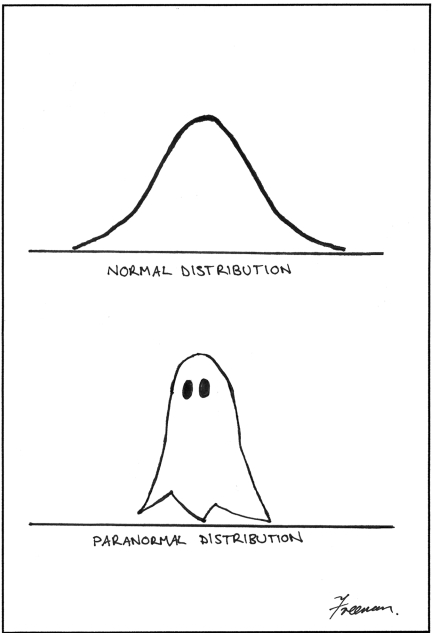
The Scariest Part of Corporate Halloween
Challenging the Status Quo: Why Your Business Doesn’t Need a Data Team
Data, Strategy, Culture & Power (New Book!)
Dean Meyer’s “How Organizations Should Work” – an A+ Reference on Intentional Organizational Design
BAD METRICS
Top 10 Business Books You Should Read in 2020
KPIs vs Metrics: What’s the Difference? And Why Does it Matter?
Next Page
Privacy & Cookies: This site uses cookies. By continuing to use this website, you agree to their use.
To find out more, including how to control cookies, see here:
Cookie Policy
Subscribe
Subscribed
Quality and Innovation
Join 255 other subscribers
Sign me up
Already have a WordPress.com account?
Log in now.
Quality and Innovation
Subscribe
Subscribed
Sign up
Log in
Report this content
View site in Reader
Manage subscriptions
Collapse this bar